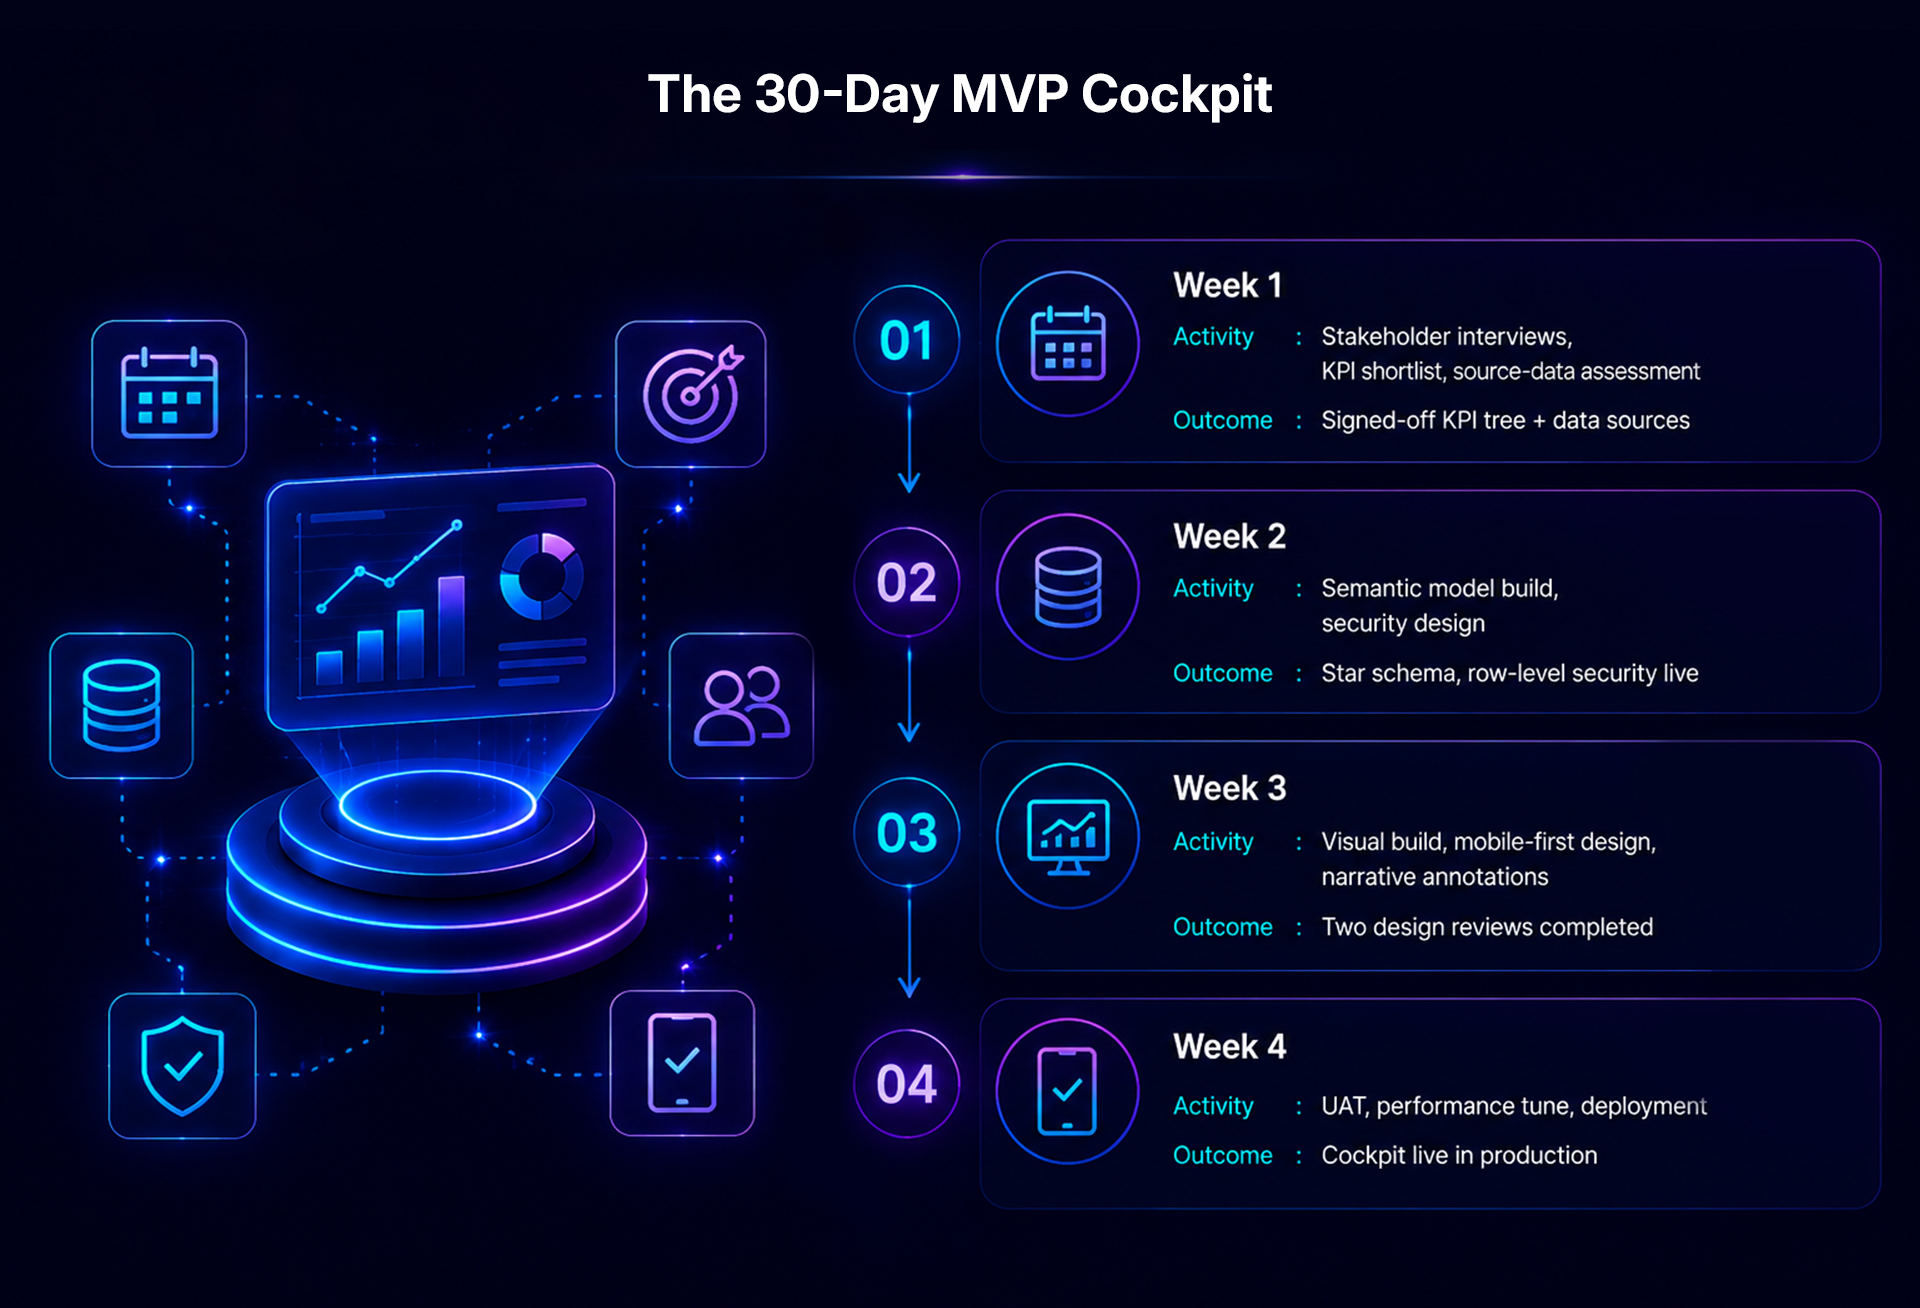
A Live Cockpit for Every Executive Who Needs One - in 30 Days.
Power BI-led control towers that surface cash, cycle time, customer health, and capacity in one mobile-first view. 30-day MVP, audit-ready security, and a model that scales.
Why Executive Dashboards Fail
They are built for analysts, not executives. Too many KPIs, no narrative, slow on mobile, and no clear next action. Our cockpit practice fixes all four.

Anatomy of a Cockpit That Gets Used
One screen, five KPIs
Discipline beats density. We say no to KPI #6 in week one
Each KPI has a "why this number changed" insight, AI-generated and reviewed
Mobile-first
The executive’s phone is the primary screen. Desktop is secondary
Drilldown to action
Every metric has a single drilldown layer that ends in something an operator can do
Daily 30-second usage pattern
Designed so the executive can open it in a lift, see the day, close it
Cockpit must load in under 3 seconds on mobile, every time. We design composite models, partition the right way, and tune the slow report away before it ships.

- Composite models mixing imported and DirectQuery sources.
- Aggregations and incremental refresh tuned per fact table.
- Premium-Per-User or Premium capacity sizing recommendation.
- Performance budget enforced in CI/CD – slow reports never reach production
Human review is the final layer not the only one. The result: AI-suggested code carries the same provenance, attestation, and quality bar as code written by hand.
Every modernization project lives or dies at the cutover. We engineer for safety from day one.
Row-level security
Aligned to org hierarchy or business-unit boundaries
Column masking
For sensitive fields (PII, financial detail) per role
SSO + MFA
Entra ID / Okta integrated. No standalone Power BI passwords
Audit logging
Every view, every export, every change captured


Beyond the Cockpit - Data Control Tower
Once the executive cockpit is live, we extend the model to the rest of the business: function-level cockpits for finance, operations, supply chain, and HR – all served from the same semantic layer.
Manufacturing
Plant performance, OEE, energy, safety
BFSI
P&L, risk, exposure, customer-onboarding throughput
Healthcare
Patient flow, throughput, quality metrics
Retail
Sales, margin, store-ops, customer health
Supply Chain
OTIF, inventory, supplier performance, exceptions
FAQ
Frequently Asked Questions
Why only 5 KPIs?
Because every executive cockpit that tried more than 5 stopped getting opened after week three. The discipline is the product.
Can the cockpit pull from our existing warehouse?
Yes – Snowflake, Databricks, Fabric, BigQuery, Synapse, on-prem SQL Server, and most BI-friendly sources. We adapt the semantic model to the source, not the other way round.
What about AI-generated narrative - is that safe for the board pack?
Yes, when the model is constrained to summarise the data the cockpit is already showing. We do not let the AI invent numbers; it explains the ones already on the screen, and every narrative is reviewable.
Ready to See Your Cockpit?
Book a 30-minute call. We will show three live cockpit examples from peer industries and put a fixed-scope, fixed-fee 30-day MVP proposal on the table.